Collecting and Making Sense of Scattered Data
I needed housing market data that nobody makes easy to get, so I built a tool to collect it myself.
When I was buying my first house, I got frustrated by how hard it was to compare prices. Redfin and Zillow will show you one listing at a time, but if you want to look at fifty homes side by side (square footage, year built, price per square foot, neighborhood), you’re stuck clicking through pages and writing things down.
So I built a tool to do it automatically. It goes to public real estate websites, pulls the data for recently sold homes in a given area, and puts everything in one place. No more toggling between browser tabs or copying numbers into a spreadsheet by hand.
But raw data off the web is messy. Prices show up as “$350,000” in one listing and “350000” in another. Some listings are missing basic info. Others are clearly not regular home sales, like vacant land or auction properties. So the tool also cleans everything up: standardizes the formats, removes the junk, and flags anything that looks off.
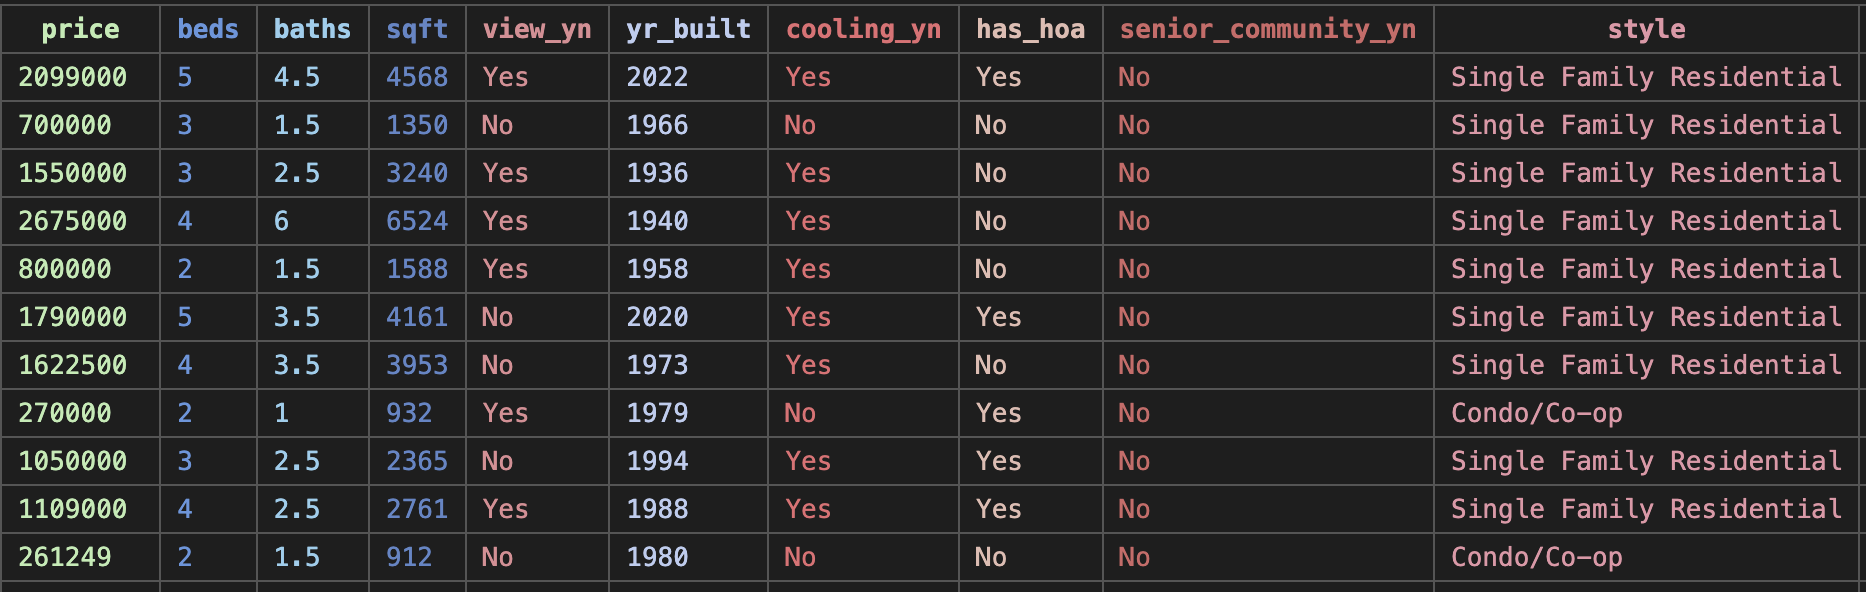
The end result is one clean, organized set of data where you can actually see what’s going on. Which neighborhoods are trending up, what homes with certain features tend to sell for, and where the outliers are.
I also used the data to build a price estimator. It wasn’t perfect. Home pricing is genuinely hard because so much depends on things you can’t easily measure, like whether the kitchen was recently renovated or whether the house is on a noisy street. But it was a great exercise in what you can learn when you get your data in order.
What this means for a business
Most businesses have their own version of this problem. Your sales numbers are in one spreadsheet. Customer info is in another. Supplier data is on some website you check manually. You know the information is there, but pulling it all together to see the big picture is a pain, so you end up making decisions on gut feeling instead.
That’s the kind of thing I help with. I can build tools that automatically pull your data together from wherever it lives, clean it up, and organize it so you can actually use it. Instead of “I think we’re doing well this quarter,” you’d actually know.
All projects